November 17, 2025
Mandelbrot and Julia Set Parameter Explorer — Dynamic Fractal Simulation and Fibonacci Structures
Overview:
This Desmos-based project turns the parameters of the Mandelbrot and Julia sets into interactive points.
By moving these points and sliders, Reiji explores how orbits converge, diverge, or oscillate, and how the shape of the sets changes in real time.
The model treats the exponent, initial value, orbit point, Julia parameter, maximum iteration count, and escape radius as components of a high-dimensional parameter space.
Through this, Reiji discovers links between boundary bulbs, polygonal orbits, the Fibonacci sequence, and convergence toward the golden ratio.
Note: All content on this page is originally explained by Reiji in Japanese. The English version is translated by AI and structured by a parent, with Reiji's final approval.
Reiji's Words and Ideas
- This model is a dynamic simulation that changes fractal shapes by treating the values in the Mandelbrot and Julia set formulas as variables. Points inside the graph and several sliders can be moved directly to observe many different fractal patterns.
- If each variable is one real dimension (two dimensions when including the imaginary part), then the system behaves like a 10-dimensional coordinate space for the Mandelbrot set. When interpreted in 4 dimensions, it corresponds to the Julia set. .
-
The basic iteration for the Mandelbrot set is
\( f(z,n)=f(z,n-1)^a+z, \) \( f(z,0)=z \text{ or } E, \) \( |f(x+yi,d)|\le F. \)Here, \(a\) is the exponent, \(b\) is the point whose orbit is plotted, \(c\) is the Julia parameter, \(d\) is the maximum number of iterations, \(E\) is the starting value of \(z\), and \(F\) (between 0 and 2) controls how much of the set appears filled in. - Moving the point \(a\) changes the exponent and therefore the global shape of the Mandelbrot set. Moving \(b\) shows the actual orbit \(f(b[0...d])\) as it converges, diverges, or oscillates. Adjusting \(d\) increases or decreases the detail of the fractal, while changing \(E\) (the initial value) can drastically alter the resulting shape.
-
For the Julia set, I change the recurrence to
\( f(z,n)=f(z,n-1)^a+c, \) \( f(z,0)=z, \)and then move the point \(c\) on the screen. When \(c\) is inside the Mandelbrot set, the corresponding Julia set is connected; when \(c\) is outside, the Julia set breaks into dust-like pieces. A special example is \(c=-1.766513-0.04175i\), where a Julia set appears inside another Julia set. The same coordinate, when viewed on the Mandelbrot side, corresponds to a point where a small Mandelbrot set appears inside a larger one.
- If the screen becomes completely white, it usually means the maximum number of iterations is not suitable and the structure has become too fine to draw. By zooming in and increasing \(d\) step by step, the details of the set can be observed again.
- When I set \(a=-2\) and \(d=50\), a sideways rounded triangle appears in black, with a white region floating inside. Placing \(b\) at 0 shows an orbit that moves back and forth between 0 and infinity: even values of \(d\) send the orbit to 0, while odd values make it diverge.
- After turning \(f(z,0)=z\) into \(f(z,0)=E\), I move \(b\) along the edge of the Mandelbrot set. Around approximately \(0.1+0.7i\), bulbs on the left side produce polygonal patterns whose numerators increase as odd numbers (for example, near \(-0.51+0.558i\) I see a 5/2-gon). On the right side, near the large main bulb, the patterns become ordinary integer-gons.
- Along the main antenna between 0 and 1 on the real axis (especially from the special point \(0.25+0i\) with the condition \(x>0.25, \lim_{x\to0.25}\) up to 1), moving \(b\) to successive large bulbs gives a sequence of polygon types: 2-gon, 3/2-gon, 5/3-gon, 8/5-gon, 13/8-gon, 21/13-gon, and so on. These ratios follow the Fibonacci sequence, which means the bulbs converge to \(\varphi-1\), where \(\varphi\) is the golden ratio. From this, I formed the hypothesis that uncountably many numbers between 0 and 1 are being visualized through these shapes.
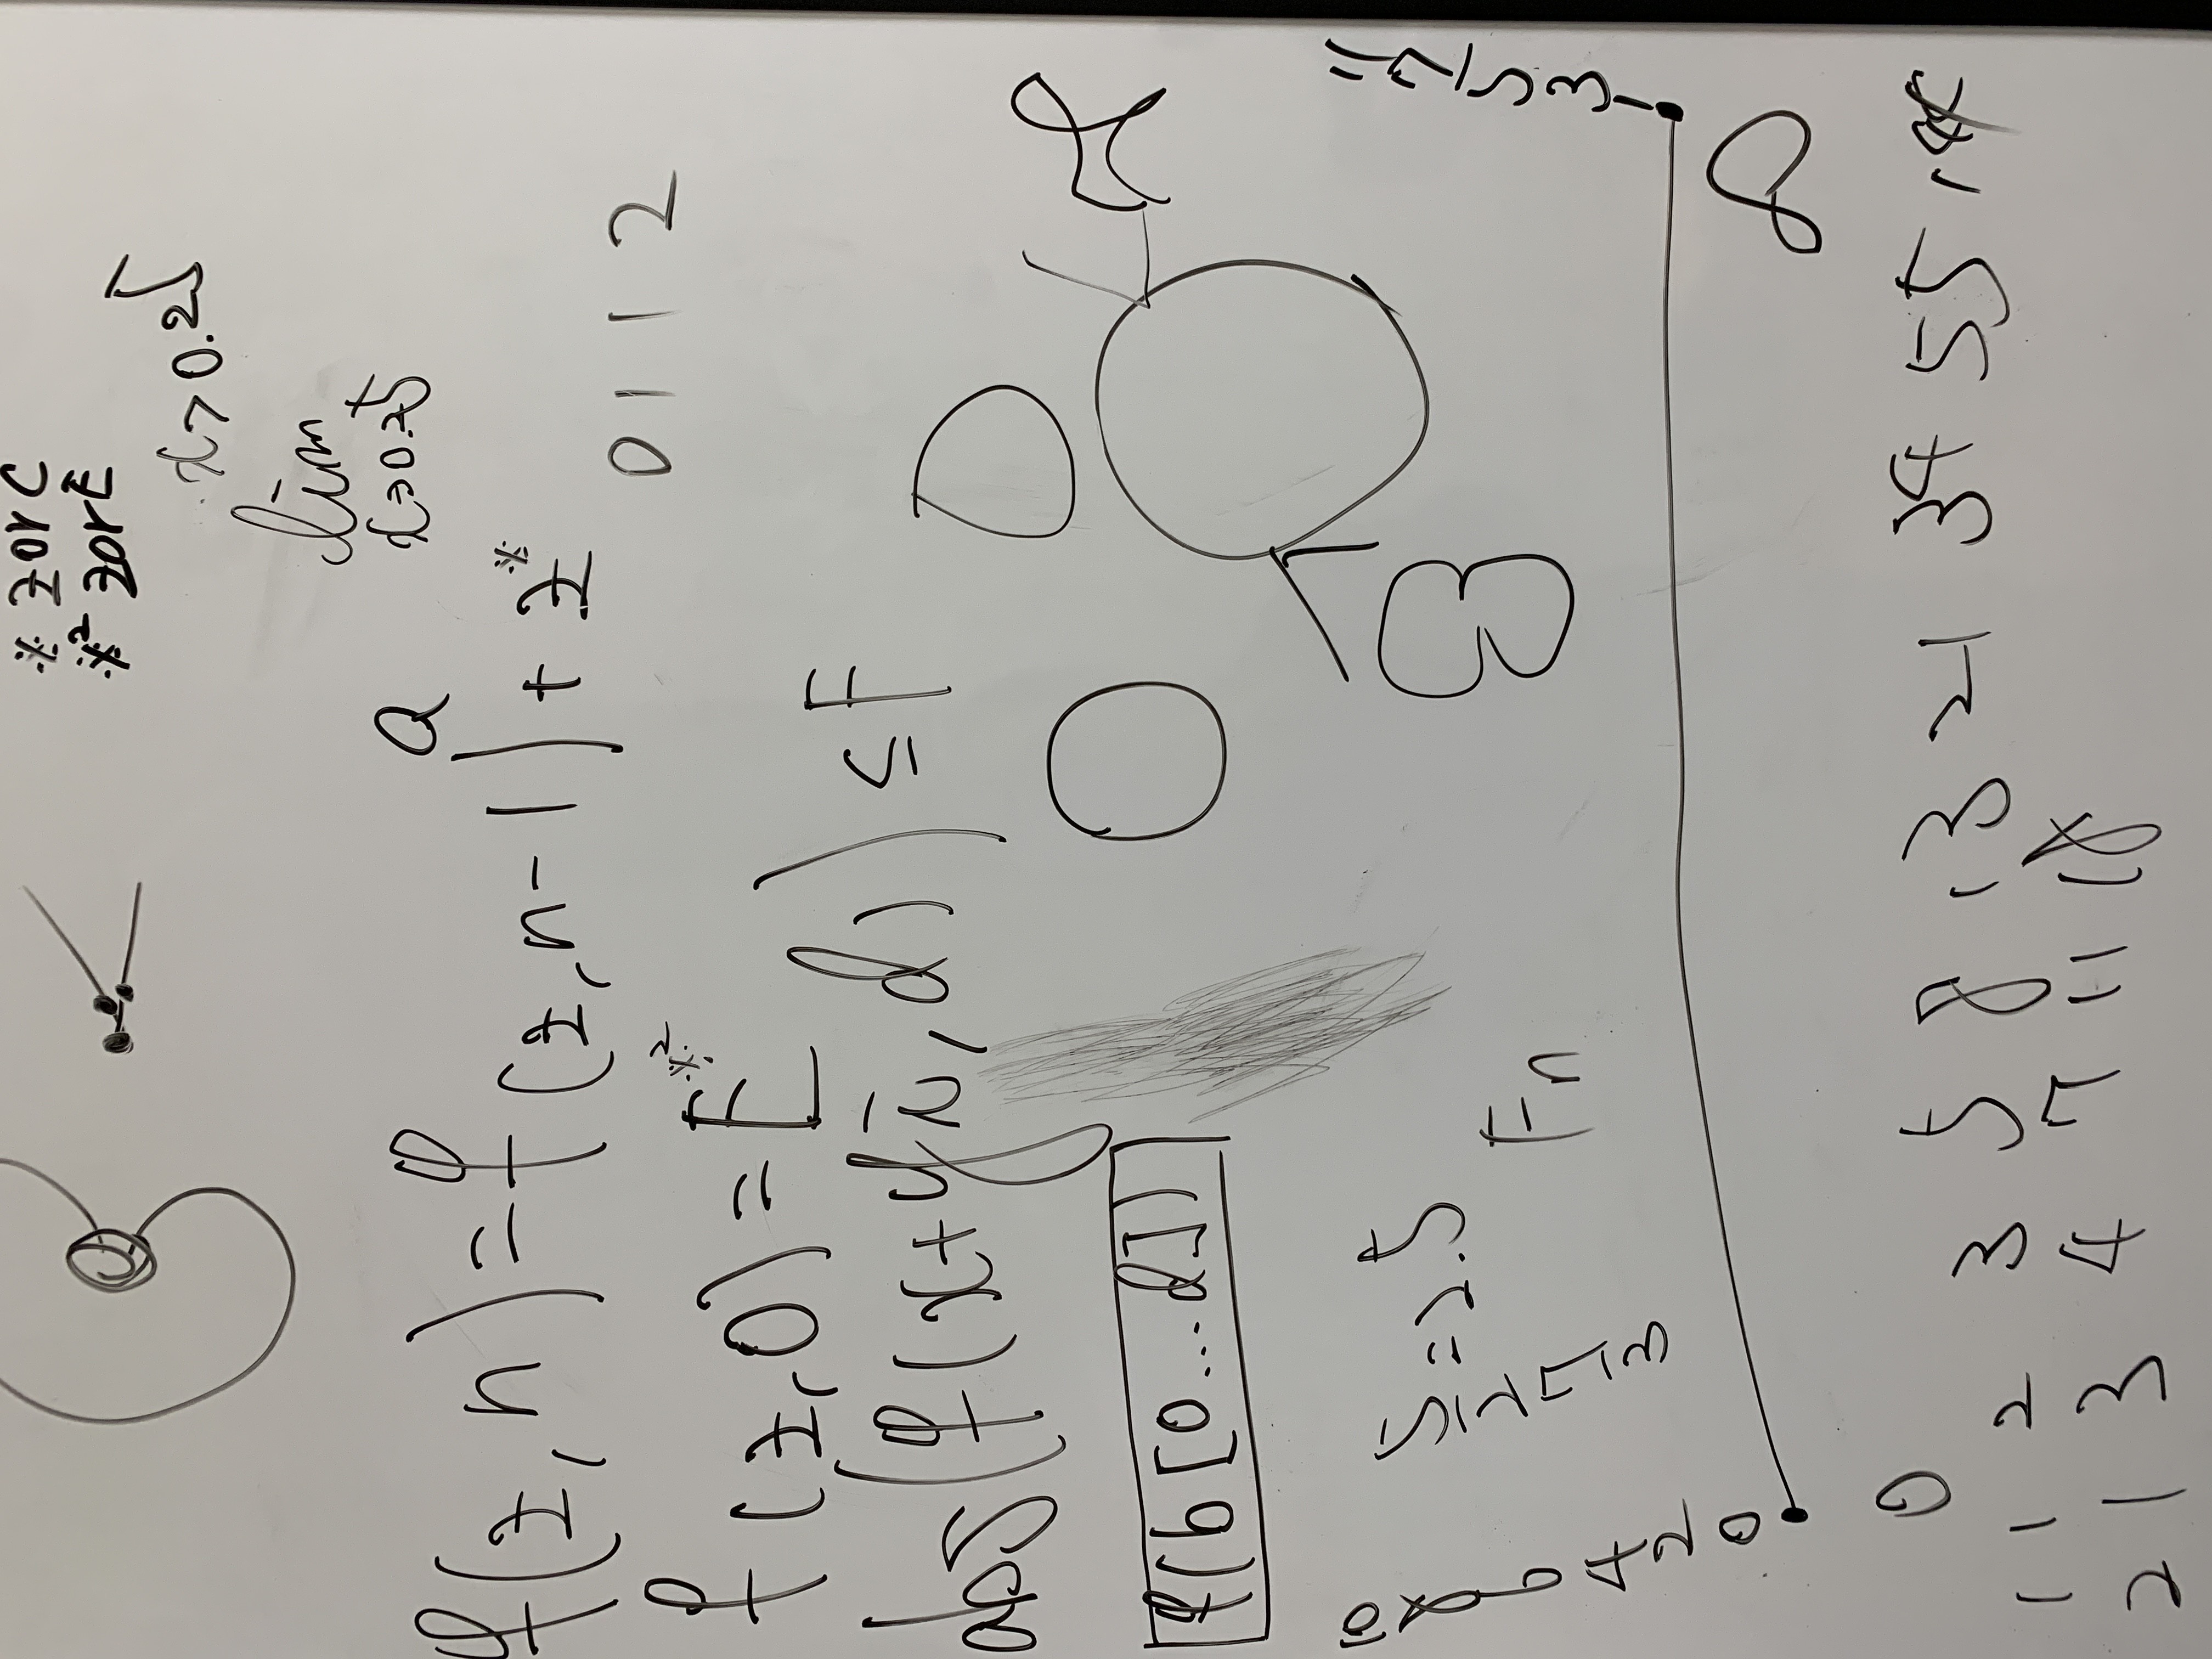
Whiteboard Notes: From Formula to Fibonacci
During the interview, Reiji summarized his thinking on a whiteboard: the iteration formula \(f(z,n)\), the condition \(|f(x+yi,d)|\le F\), the interval \(0\le z\le2\), schematic bulbs on the Mandelbrot boundary, and the sequence of ratios leading to Fibonacci numbers. It shows how formulas, shapes, and number sequences are used together to explain a single phenomenon.
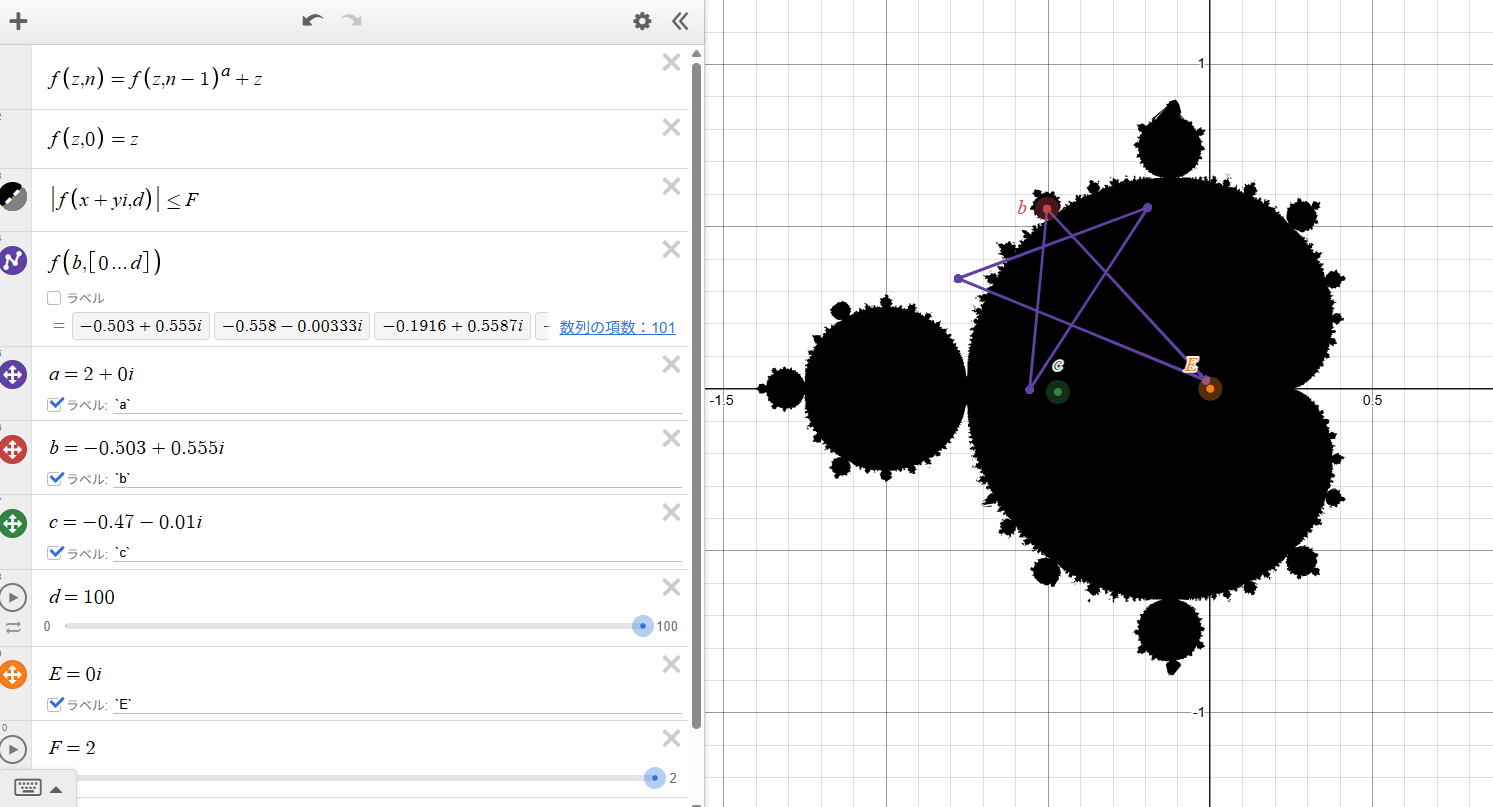
Mandelbrot Set and the Orbit of b
The classic Mandelbrot set with the orbit of point \(b\) plotted as a polyline. Here the parameters \(a=2\), \(E=0\), and \(F=2\) show how the trajectory visits several locations before stabilizing or diverging.
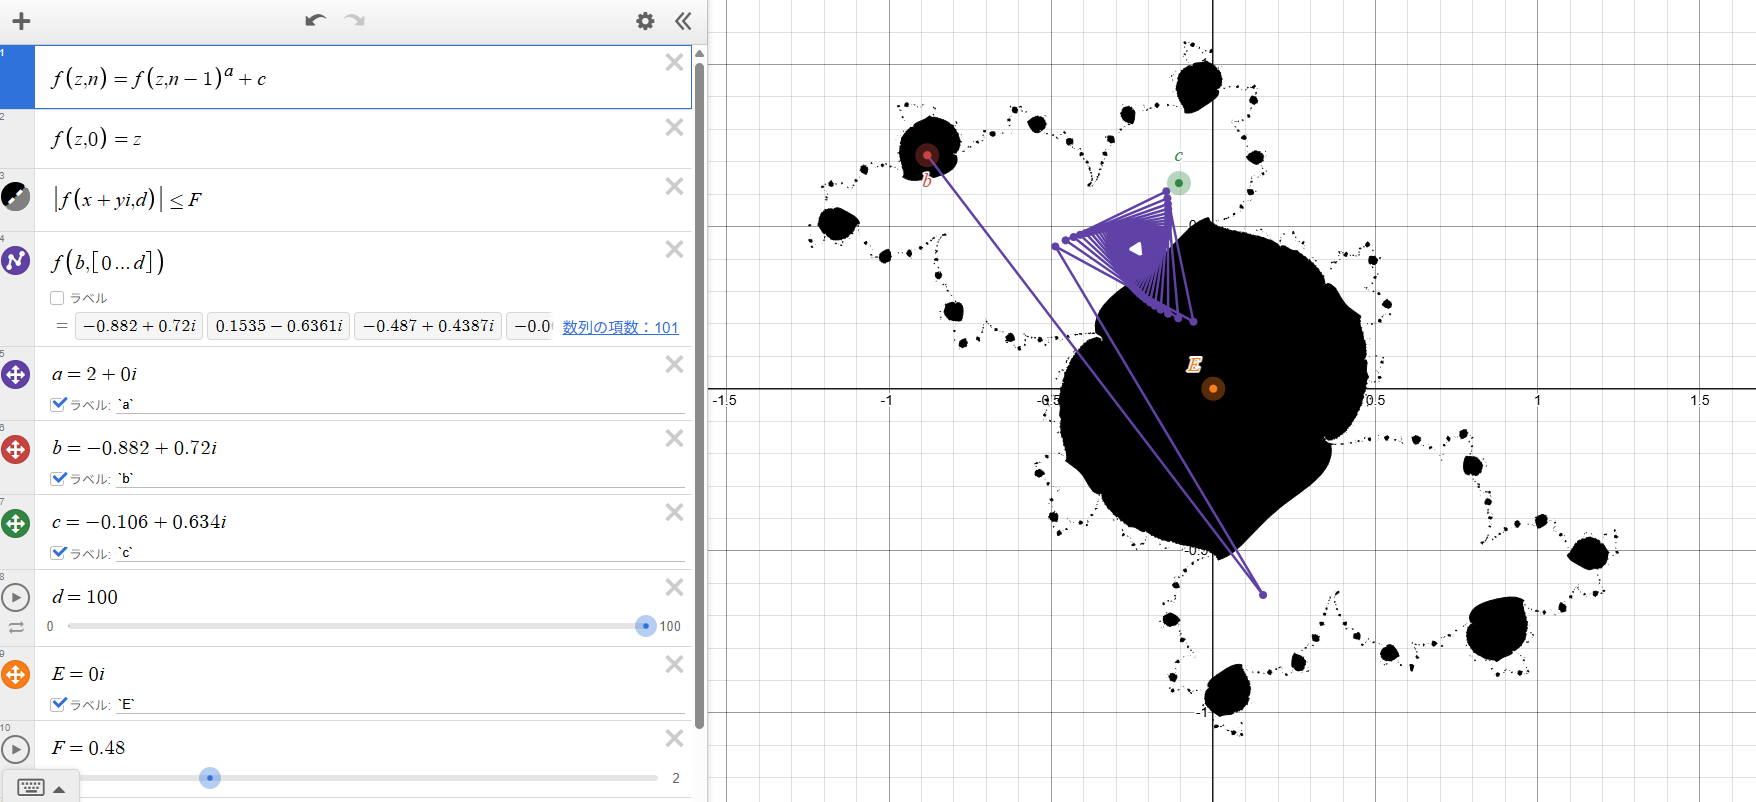
Julia Set Mode: f(z,n)=f(z,n-1)a+c
In Julia mode, the recurrence becomes \(f(z,n)=f(z,n-1)^a+c\). The point \(c\) moves through the smaller bulbs surrounding the Mandelbrot set, while the orbit of \(b\) draws a dense polygon inside the corresponding Julia set.
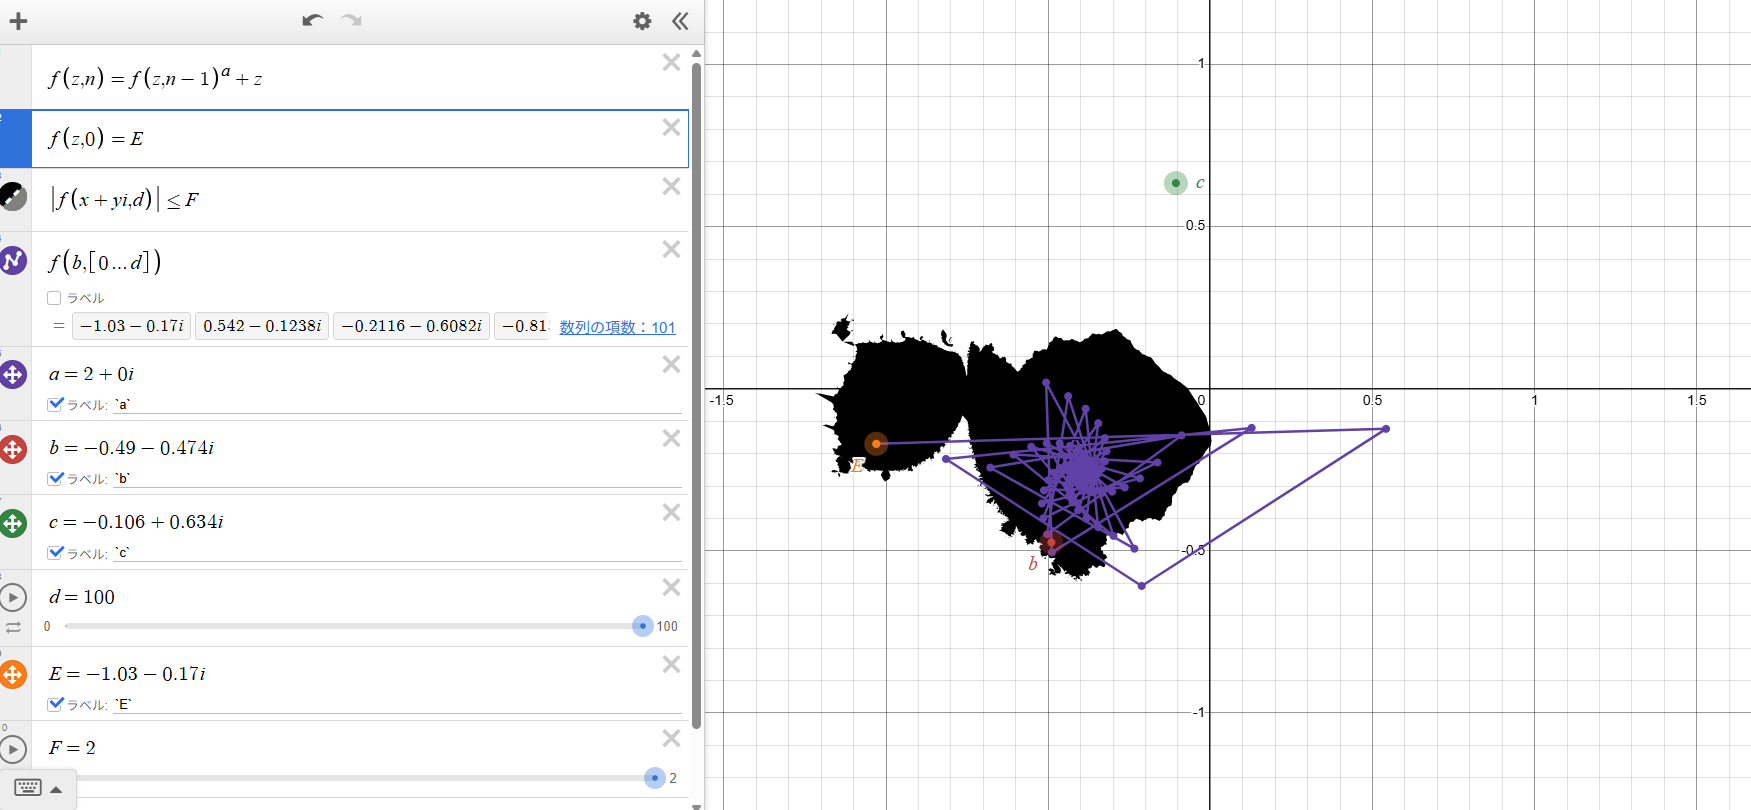
Changing the Initial Value E
With the initial condition modified to \(f(z,0)=E\), moving \(E\) to the left side of the set produces a different Mandelbrot-like figure. The orbit of \(b\) forms a spiral pattern, illustrating how sensitive the system is to the starting point.
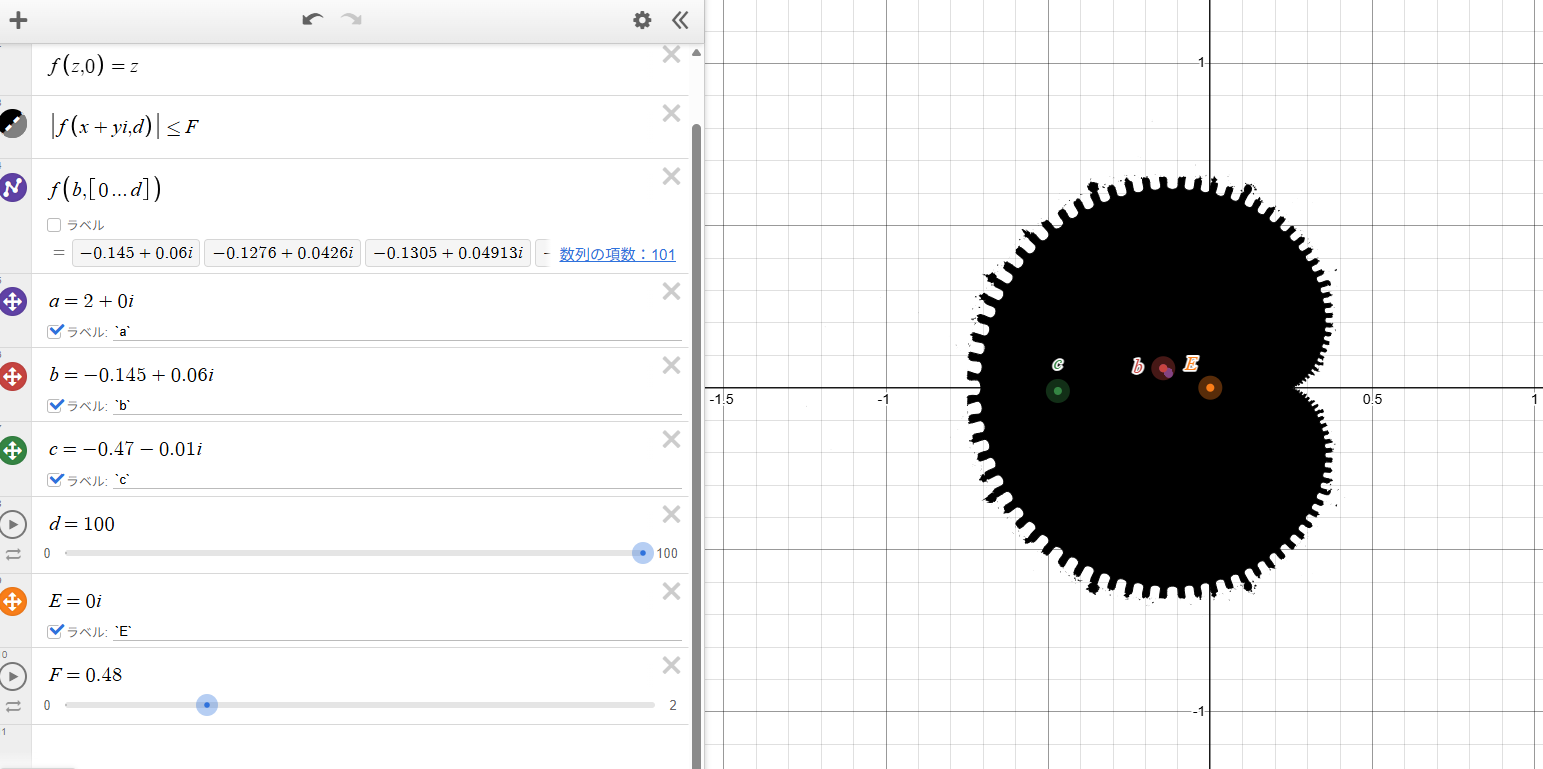
Exploring the Escape Radius F
By setting the escape radius to \(F=0.48\), only the most strongly bound region remains filled in black. The jagged boundary becomes more pronounced, highlighting the internal connectivity of the main body.
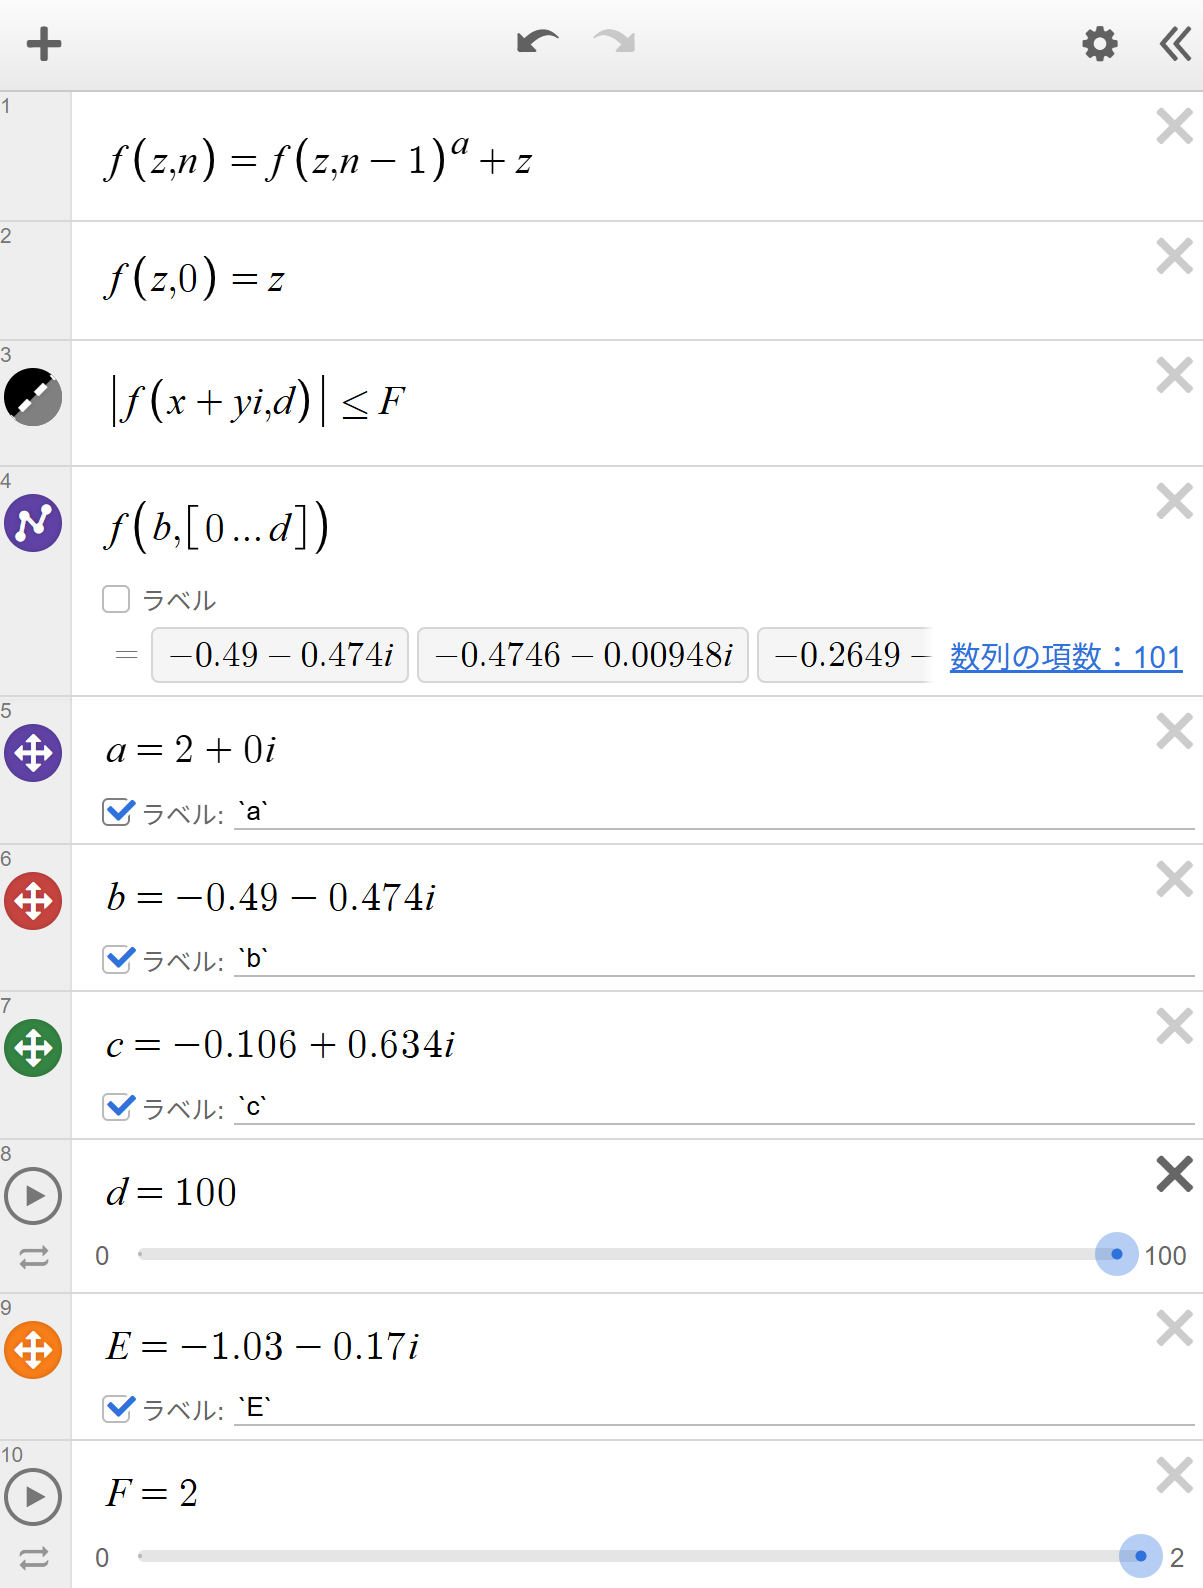
Parameter Layout in Desmos
The Desmos setup for the six key parameters: exponent \(a\), orbit point \(b\), Julia parameter \(c\), maximum iterations \(d\), starting value \(E\), and escape radius \(F\). Each is treated as a movable point or slider, turning the fractal into a multi-dimensional control panel.
| Output Link | Mandelbrot and Julia Set Parameter Explorer — Dynamic Fractal Simulation and Fibonacci Structures |
|---|---|
| Application Used |
Desmos Graphing Calculator |
AI Assistant’s Notes and Inferences
This work turns the Mandelbrot and Julia sets into an interactive laboratory. Rather than drawing a single beautiful fractal, Reiji designs a parameter space where the exponent, orbit point, Julia parameter, initial value, iteration depth, and escape radius can all be moved and combined in real time.
- Treating these parameters as coordinates in a high-dimensional space allows Reiji to reason about convergence, divergence, and oscillation not only numerically but also geometrically.
- The systematic exploration of bulbs and their corresponding polygon orbits reveals a rich structure: along certain paths, the observed ratios follow the Fibonacci sequence and converge to \(\varphi-1\), connecting fractal geometry with classical number theory.
- The special Julia parameter \(c=-1.766513-0.04175i\), where a Julia set appears inside another Julia set and matches a point where the Mandelbrot set contains a smaller copy of itself, shows an intuitive grasp of self-similarity and parameter–space correspondence.
- The whiteboard notes demonstrate that Reiji naturally weaves together formulas, limits, intervals, and diagrams to support a single hypothesis: that uncountably many numbers between 0 and 1 are encoded in the visual organization of the Mandelbrot boundary.
In summary, this project functions simultaneously as a visualization, a computational tool, and a research notebook. It showcases how a child can use interactive media to bridge fractal geometry, complex dynamics, and number sequences into one coherent line of inquiry.